GMT/Python update and feedback from Scipy 2017
Last week I presented the first working prototype of GMT/Python at Scipy 2017, which is my favorite conference. I got a lot of excellent feedback about the project and will need to make some major changes as a result. Sadly, I wasn’t very good at managing my time during the talk and didn’t get to show the internals of the library. I’ll use this post to describe how things are currently implemented, what I learned from the feedback, and what changes I’m making to the code base.
Before we dive in, you can watch my talk on YouTube or just take a quick look at my slides.
Running the code
You can try out the demo notebook from the talk if you’re on Linux or OSX (sorry Windows users, we’re working on it). First, you’ll need to install an alpha version of GMT 6.0.0 from conda-forge:
conda install gmt=6.0.0a5 -c conda-forge/label/dev
I should note that this only works because of the amazing help I got from Filipe Fernandes, Mike Hearne, and Ray Donnelly during the Scipy sprints.
Now you can install the GMT/Python version from the talk:
pip install https://github.com/GenericMappingTools/gmt-python/archive/0e2b118.zip
Current implementation
All our code is hosted on the
GenericMappingTools/gmt-python
repository on GitHub.
The Python package itself is called gmt so that you can import gmt
instead of import gmt-python (which looks a bit silly).
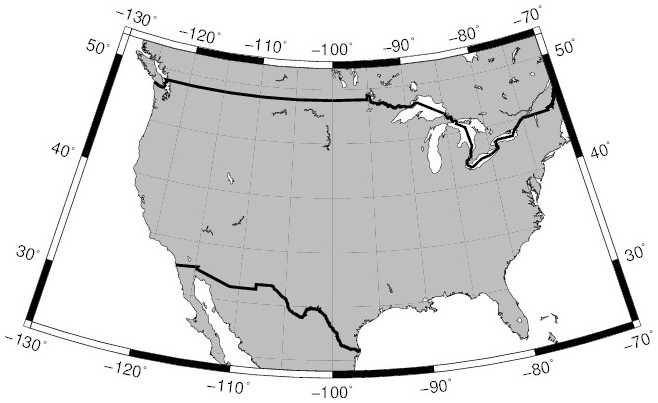
The following example wasn’t on the video but it shows what is currently
possible with the library:
import gmt

## Start a new figure
gmt.figure()
## Plot coastlines of North America using readable aliases for the arguments
gmt.pscoast(region=[-130, -70, 24, 52], projection="B-100/35/33/45/6i",
            land='gray', frame='a', portrait=True, shorelines='thinnest',
            borders='1/thickest', area_thresh=500)
## Embed the figure in the notebook
gmt.show()
Here is what the file structure of the gmt package looks like:
gmt
├── __init__.py
├── clib/
│   ├── __init__.py
│   ├── constants.py
│   ├── core.py
├── decorators.py
├── extra_modules.py
├── ps_modules.py
├── session_management.py
├── tests/
│   ├── __init__.py
│   ├── baseline/
│   ├── data/
│   ├── test_*.py
│   └── utils.py
└── utils.py
Low-level wrappers
The subpackage gmt.clib contains all of the low-level ctypes code that
interfaces with libgmt.
A user will not need see or use this package.
The main function that we need from the C API is GMT_Call_Module, which is
wrapped by gmt.clib.call_module.
This is how we execute all of the
GMT modules
(pscoast, grdgradient, etc).
Each module is implemented as a function in one of the
*.py files in the gmt package.
For example, the Postscript generating modules live in gmt/ps_modules.py.
These “module functions” are all accessible from the top-level package
namespace.
This means that you can access them as gmt.pscoast instead of
gmt.ps_modules.pscoast.
All of the unit and integration tests live in gmt.tests and are shipped with
the package.
Also included is a gmt.test() function that runs all of our tests using
pytest.
I’ll go over how we run the tests below.
Module wrapper functions
This is what a function that wraps a GMT module looks like:
@fmt_docstring
@use_alias(R='region', J='projection', A='area_thresh', B='frame',
           D='resolution', P='portrait', I='rivers', N='borders',
           W='shorelines', G='land', S='water')
@kwargs_to_strings(R='sequence')
def pscoast(**kwargs):
    """
    Plot continents, shorelines, rivers, and borders on maps

    ...

    {gmt_module_docs}

    {aliases}

    Parameters
    ----------
    {J}
    {R}
    A : int, float, or str
        ``'min_area[/min_level/max_level][+ag|i|s|S][+r|l][+ppercent]'``
        Features with an area smaller than min_area in km^2 or of hierarchical
        level that is lower than min_level or higher than max_level will not be
        plotted.
    {B}
    C : str
        Set the shade, color, or pattern for lakes and river-lakes.
    ...

    """
    with APISession() as session:
        call_module(session, 'pscoast', build_arg_string(kwargs))
The function takes keyword arguments (**kwargs) and must have the same name
as the corresponding GMT module, in this case pscoast.
In the Python wrapper, the ps prefix doesn’t really make much sense because
we don’t need to care that this module writes Postscript.
We’ll implement aliases for the function names later on to deal with this.
The body of the function is quite simple and is only two lines.
First, we need to create a GMTAPI_CTRL C structure that is required by all
GMT functions.
The gmt.clib.APISession context manager takes care of creating the structure
by calling GMT_Create_Session from the C API, handing us a pointer in the
session variable, and destroying it on exit using GMT_Destroy_Session.
Next, we use gmt.clib.call_module to execute the pscoast GMT module.
This function wraps GMT_Call_Module from the C API
and receives inputs as a string of command-line arguments, like '-R1/2/3/4 -JM4i ...'.
Function build_arg_string from the gmt.utils module takes care of
transforming the kwargs dictionary into that string.
Notice that this functions doesn’t pass in any data to the C API. We’re still working on that.
The majority of the parsing work is being done by the decorators (the things
with @ symbols) that live in gmt.decorators.
The first is kwargs_to_strings that takes care of converting some of the
function arguments into string representations.
By default, it will convert any boolean arguments (True or False)
into the empty string (if True) or remove the argument from kwargs (if
False).
For example, P=True will be transformed into P=''
so that the argument string made by build_arg_string will be -P.
kwargs_to_strings also allows specifying special conversions.
Here, we ask it to convert the R argument into a string if it’s a sequence
(list, tuple, etc).
So if given R=[1, 2, 3, 4] it will replace that with R='1/2/3/4'.
The argument aliases are handled by use_alias.
The format is ARG='alias' and it will replace any instance of 'alias' in
kwargs with 'ARG'.
This allows all other functions to only deal with the GMT version of the
arguments and not have to worry about the aliases.
Finally, fmt_docstring inserts stubs into the docstring,
like a list of aliases (provided by use_alias), a link to the GMT module
documentation, common arguments, etc.
See the decorator
docstring
for a full list.
Tests
The testing code is packaged with the library in gmt.tests.
We use
pytest-mpl
to test plot generating commands.
I had to hack together a class that implements a savefig method to make
pytest-mpl work.
This is bundled in a decorator called figure_comparison_test.
A typical test looks like this:
from .utils import figure_comparison_test
from .. import figure, pscoast


@figure_comparison_test
def test_pscoast_aliases():
    "Test that all aliases work"
    figure()
    pscoast(region='-30/30/-40/40', projection='m0.1i', frame='afg',
            rivers='1/1p,black', borders='1/0.5p,-',
            shorelines='0.25p,white', land='moccasin', water='skyblue',
            resolution='i', area_thresh=1000, portrait=True)
When you run the tests, pytest-mpl will generate the figure and compare it to a
baseline that we have stored in gmt/tests/baseline.
Changes after Scipy
Paul and I had the chance to talk about the project with a lot of smart and interesting people. Many thanks to Joe Kington, John Leeman, Ryan May, Filipe Fernandes, Mike Hearne, and Benjamin Root.
Code of conduct
Since a few people seemed interested in contributing to the project, I decided to add a Code of Conduct to ensure that everyone who wants to get involved know the rules. I copied it from the Contributor Covenant template. It’s so easy that there’s no excuse for not having one anymore.
I also adapted the great “Impostor syndrome disclaimer” from the MetPy project. This was originally proposed by Adrienne Lowe during an awesome Pycon talk. I highly recommend that you take a few minutes to watch it.
Object oriented API
By far the most requested feature was to have an object-oriented API, like that of matplotlib. I can see the appeal and usefulness of this and was convinced to make the change. It makes sense and we’re already doing something like it in an ugly way to be able to use pytest-mpl.
What I’m not willing to do is to support both the existing API with functions and one with classes at the same time. I don’t like that there are two ways of doing the same thing in matplotlib. It causes unnecessary confusion, particularly if you’re new to the library. And it goes against the Zen of Python:
There should be one-- and preferably only one --obvious way to do it.
So I’m going all in with the classes.
Note that this will only impact the figure generating functions.
Other parts of GMT will still be wrapped by functions in the gmt package.
The new API will look something like this:
import gmt

## Start a figure
fig1 = gmt.Figure()
## Start a different figure
fig2 = gmt.Figure()

## Use the methods in the Figure class to plot things
fig1.pscoast(region=[-130, -70, 24, 52], projection="B-100/35/33/45/6i",
             land='gray', frame='a', portrait=True, shorelines='thinnest',
             borders='1/thickest', area_thresh=500)

## We can now alternate between figures when plotting
fig2.pscoast(region=[-130, -70, 24, 52], projection="B-100/35/33/45/6i",
             land='blue', frame='a', portrait=True)

## Use savefig to save to a file
fig1.savefig('north-america.pdf')
fig2.savefig('north-america-blue.png')
The Figure class can know how to plot and insert itself in the notebook using
the
rich display
features in IPython.
I can think of a few possibilities to view the figures in the Jupyter notebook:
-
Include
figin the last line of the notebook. I don’t like this at all because it’s ugly. But it should work anyway even if we go with another option.fig = gmt.Figure() fig.pscoast(...) fig -
All
Figuremethods return the figure itself so it’ll be picked up by the notebook. This eliminates the need for the ugly trailingfig. A problem with this approach is that the last line in the cell needs to be a call tofig.something.fig = gmt.Figure() fig.pscoast(...) -
Have a
Figure.show()method that inserts the figure into the notebook. This is a nice explicit solution to the problem. The only drawback I can see is that you wouldn’t be able to show more than on figure at a time. But I’m OK with that.fig = gmt.Figure() fig.pscoast(...) fig.show() -
Have a
gmt.show()function that displays all currently active figures. This would require that we keep track of all figures created in a global variable in the package namespace. I don’t know if I like this too much because it requires mutating global variables, which can cause a lot of hard to track down bugs.fig = gmt.Figure() fig.pscoast(...) gmt.show()
I’ll probably implement some form of the show function to
make it display a pop-up window in the terminal
as well.
This is a case where a user might want the gmt.show option to view more than
one figure.
These options are not mutually exclusive. What I’m still pondering is whether or not to implement some of them (#1 will always be possible). Since I work mostly on the notebook, I don’t care too much about #4. But I’m sure a lot of you have different needs and preferences.
How would you prefer to display your images? What would you like to see in the API? Let me know in the comments or on GitHub.